8.5 EMP_fitline_plot
The module EMP_fitline_plot can plot the fitting line.
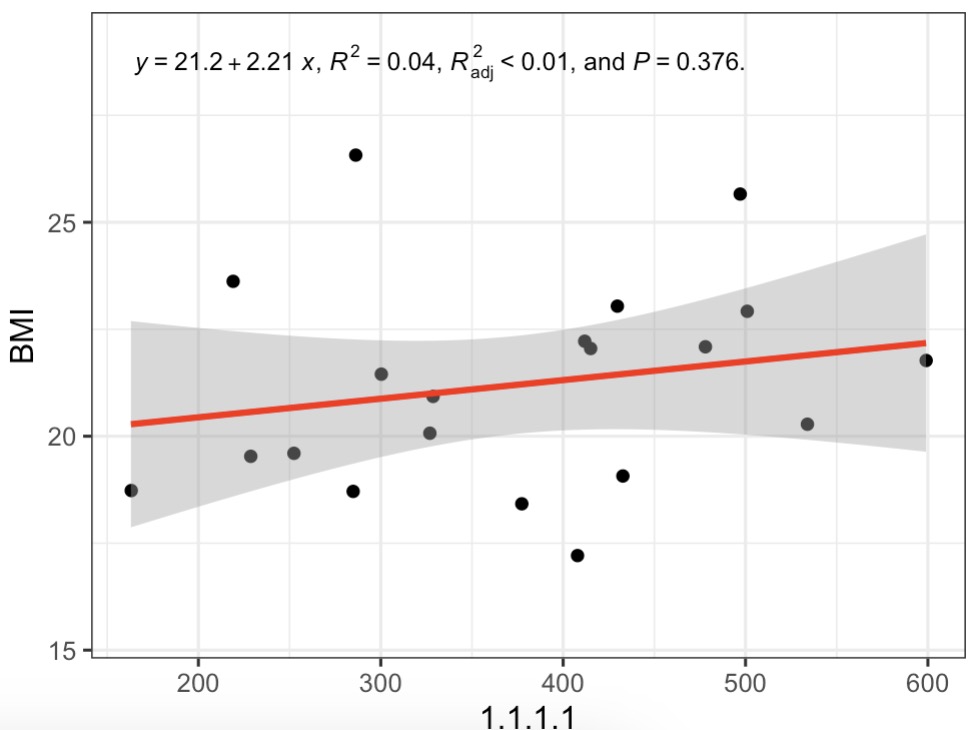
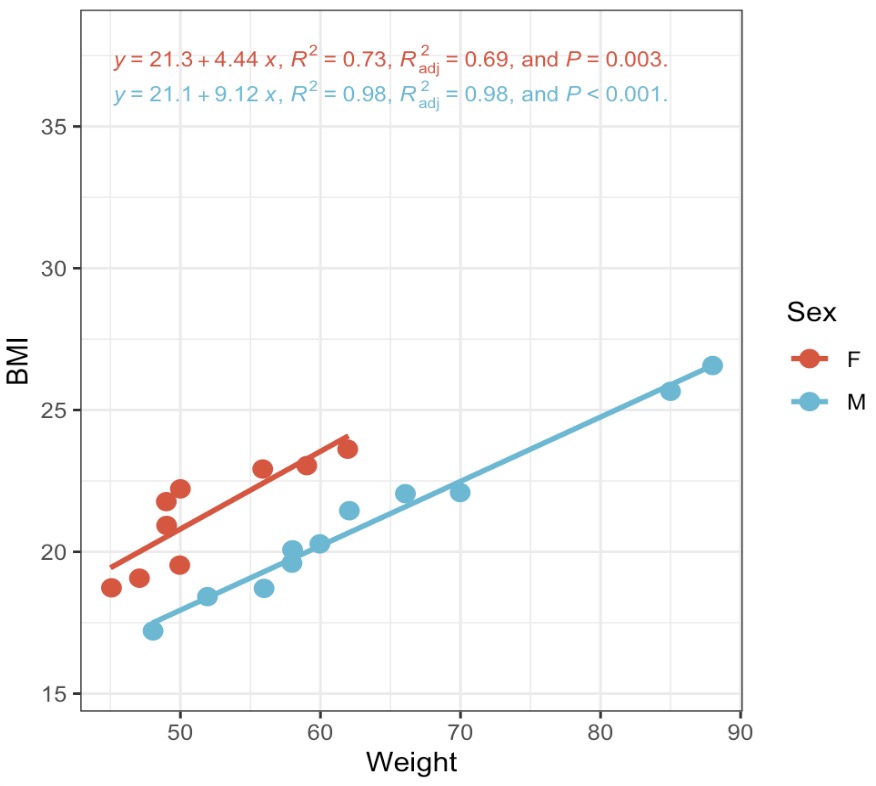
8.5.1 For single-omic data
Note:
①Parameter
②Parameter
③Parameter
①Parameter
show can provide interactivate html document.②Parameter
estimate_group can divide data according to the coldata.③Parameter
formula can adjust the formula.
🏷️Example:
## For EMPT
MAE |>
  EMP_assay_extract('geno_ec') |>
  EMP_fitline_plot(var_select=c('1.1.1.1','BMI'),formula = y ~ poly(x, 1))

MAE |>
  EMP_assay_extract('geno_ec') |>
  EMP_fitline_plot(var_select=c('Weight','BMI'),estimate_group='Sex',show='pic')
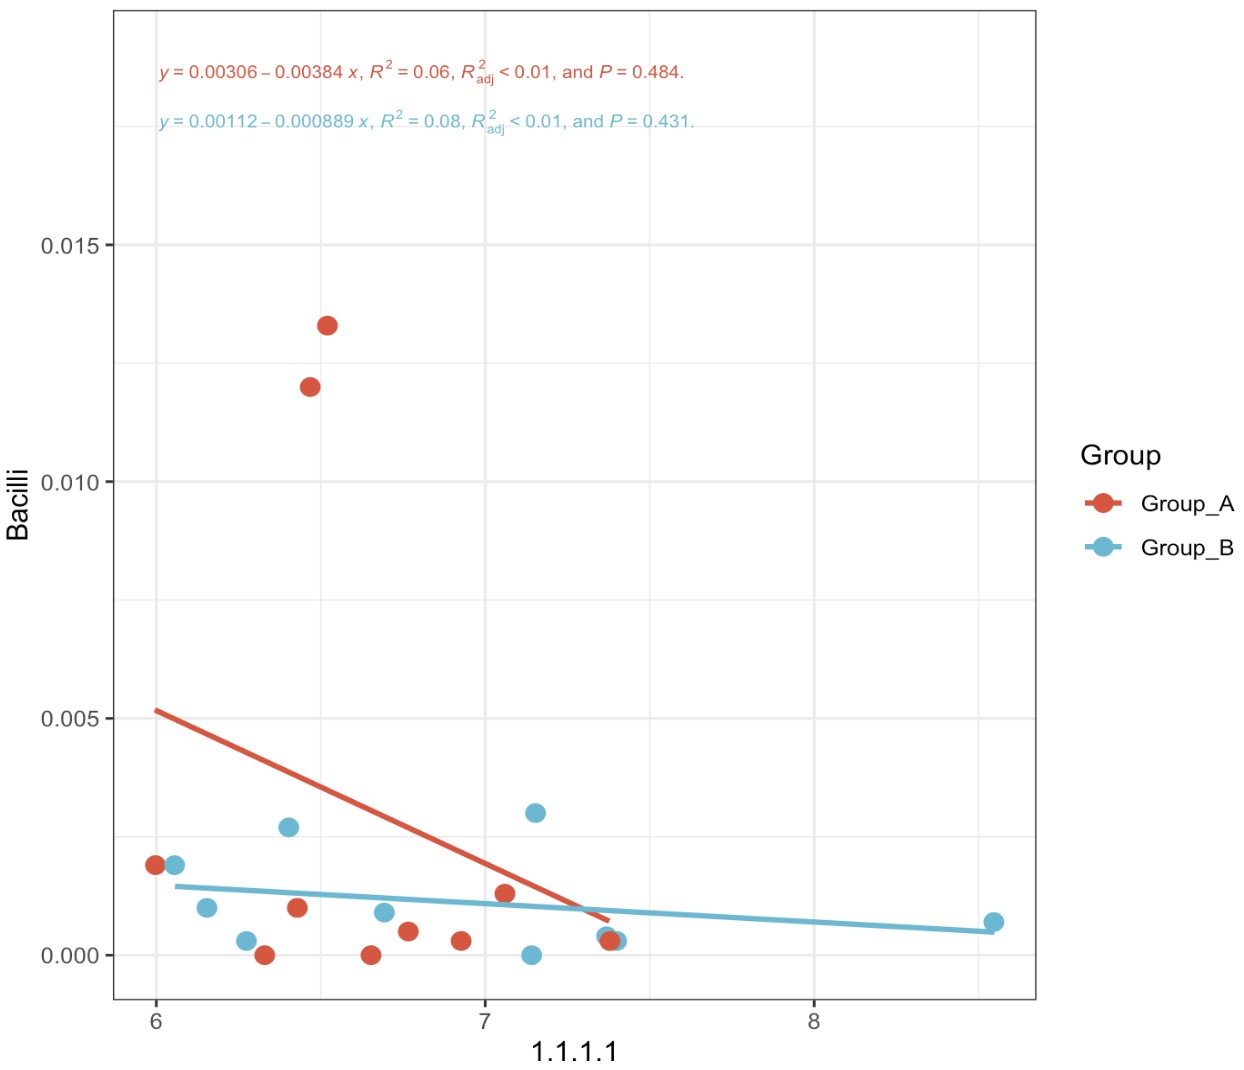
8.5.2 For multi-omics data
🏷️Example:
## For EMP
k1 <- MAE |>
  EMP_assay_extract('geno_ec') |>
  EMP_decostand(method = 'clr')

k2 <- MAE |>
  EMP_assay_extract('taxonomy') |>
  EMP_collapse(collapse_by='row',estimate_group = 'Class',method = 'sum') |>
  EMP_decostand(method = 'relative')

(k1 + k2) |>
  EMP_fitline_plot(var_select=c('1.1.1.1','Bacilli'),
                   estimate_group='Group',eq_size=2.5)